SEO Tactic #7: AB testing your Organic Search Snippets.

AB Testing Your Organic Search Snippets
Meta descriptions, the little snippets that show up when you Google something…what business really needs ‘em, right?
Before you answer, let’s walk a moment in a hypothetical online shopper’s shoes…
Summer’s around the corner, and let’s say that 2018 is the year you finally invest in that giant inflatable pool float. You’re envisioning a 6-seat, 14-foot giant unicorn, but you want to shop around a bit – and unfortunately Geoffrey the Giraffe and Toys R Us have gone the way of the dinosaurs. So you’re at your computer, credit card in hand, and you’ve searched Google for “giant pool floats.”
Chances are you’re glancing over the meta descriptions before deciding which pages to visit. But chances also are that most of our imaginary pool float retailers, like 63 percent of website owners according to one study, won’t have dedicated any time to write one.
Findings in RankSense’s research have continually indicated that small efforts towards crafting the right meta description can mean big payoffs in terms of a page’s click-through rates (CTRs). And pool float salesman or not, unless you can rely completely on name recognition to ensure clicks, carefully written meta descriptions are a built-in chance to attract a customer and make a sale – a free shot at hooking them and reeling them in. So why is it that retailers continue to pass up this opportunity to engage their customers?
Taking your meta description game to the next level
Perhaps I’m preaching to the converted. Maybe you’re hip to the importance of meta descriptions and you’ve read our blog post discussing strategies for crafting compelling, unique, and informative snippets. Maybe you’ve got some different strategies in mind, and you want to test some different descriptions out. What then?
In this age of mega ecommerce and big data, simple, straightforward trial and error isn’t going to cut it – to compete in the big leagues, finding what works means running analysis the way the pros do. Fortunately, with a little know-how, stepping up your meta description game doesn’t have to be a time-intensive, costly endeavor.
If you’ve got ten minutes, this post is going to cover the nitty-gritty of performing an AB statistical analysis to test how different meta-descriptions can affect traffic to your site’s pages. We’ll be assigning each of your site’s pages to different test and control groups, with each group employing a different snippet strategy you aim to test. By measuring which snippet strategies work best, you’ll gain the insight needed to increase your pages’ click-through rates – you’ll be able to drive more organic traffic to your site, and you’ll increase your organic revenue.
Step 1: Gather traffic data
Before assigning your site’s pages to test and control groups, we need to determine how much traffic each page gets daily. Without ascertaining which pages get the most, we might assign a large number of high-traffic pages to the same test group, rendering the relative success observed for a particular meta description inconclusive.
So, to avoid sampling bias, we’re going to gather traffic data for each page using Google Analytics. What we want to know is the number of unique visits to each page on the site, per day. In truth, how you go about doing this is up to you, but we tend to use the Google Analytics google sheets addon.
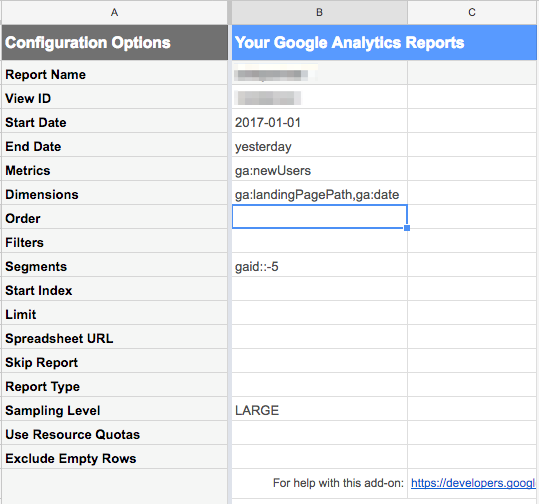
Using the addon is easy – the first time you use it you’ll want to select “create new report” and you’ll be shown a context menu that will help you fill in the relevant parameters.
For the sake of our AB tests, we typically use the ga:newUsers metric, and the ga:landingPagePath and the ga:Date dimensions. When grouping by multiple dimensions, use a comma to separate them.
The “metric” row will be the actual numerical value you’re looking for – in this case, unique new users visiting the site. The “dimensions” row will be how the results are grouped. In this case, they’re grouped by the date and the page that was visited.
Finally, the “segments” row will correspond to the type of google analytics data you’re querying. “ga::-5” corresponds to organic, unpaid search traffic. You can find a handy list of the various segments available here.
If you’re familiar with SQL, this set of parameters might look similar to the following SQL statement:
SELECT SUM(newUsers), date, page FROM google_analytics GROUP BY date, page WHERE segment = “organic_search”
You’ll notice a number of parameters that weren’t in the create report context menu. The only ones we need to worry about for now are the Start Date and End Date. For the sake of running an AB test, I typically grab anywhere from 6 months’ to a year’s worth of data. But you might choose to go with a shorter period of time if you receive a lot of traffic, or if the amount of traffic on all your pages has recently changed dramatically.
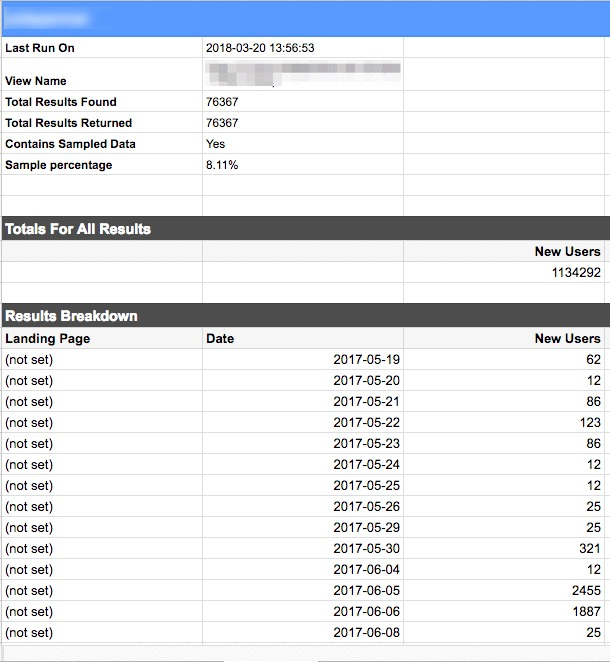
Now, after you’ve run the report (by selecting “run reports” instead of “create new report” in the drop down) you’ll notice a new sheet at the bottom. This will contain the data you’re after.
Step 2: Stratified sampling
Now that we have our data, we can begin the process of assigning pages to test and control groups, with each group employing a different snippet strategy.
As noted above, we can’t just randomly assign each page to a test or control group. We need the statistical properties of our test and control groups to be as similar to one another as possible. Said another way, we want each group to look as identical as possible – that we can confidently attribute changes in traffic to the group’s particular meta description strategy, and not to sampling bias or random flukes.
To accomplish this we’re going to use a technique known as “stratified sampling”. The basic gist is we sort the pages by how much total traffic they received over the time period selected, and we assign them to evenly sized groups known as “ntiles.” For example, the following represents a set of 10 pages sorted by total traffic, and grouped into 5 Ntile groups:
| Page |
Aggregate Total Traffic |
NTILE |
| Page 1 |
1 |
1 |
| Page 2 |
1 |
1 |
| Page 3 |
4 |
2 |
| Page 4 |
5 |
2 |
| Page 5 |
5 |
3 |
| Page 6 |
10 |
3 |
| Page 7 |
13 |
4 |
| Page 8 |
14 |
4 |
| Page 9 |
20 |
5 |
| Page 10 |
31 |
5 |
Note also that you don’t have to use the total traffic, but could just as easily use the average daily traffic, or the median daily traffic, etc. What you decide to use might be influenced by how long the time period you chose in step 1 was, or your own knowledge of how variable traffic on your pages typically is.
You could even try to sort the pages by more than one value – for example, by total traffic and median daily traffic – and create ntiles based on that sorted list. The choice is yours, and will require some experimentation.
In any case, once you’ve stratified your ntiles you’re ready to do the sampling.
Conceptually this is very simple, we want to take a random sample from each ntile group, numbered 1-5 above. With 5 ntile groups, and 2 pages per group, we can do this a maximum of two times without replacing the pages once they’ve been sampled. In all likelihood you’ll want more than just two sample groups for your AB test, but for the purposes of this example two’s enough.
Concretely using the above dummy data we might end up with 1 sample group with pages [1, 4, 5, 8, 9], and another with pages [2, 3, 6, 7, 10].
Now, as an optional (but helpful) step, we want to calculate how similar each of our sample groups are to one another, and use the most similar groups as our control groups. We’ll see why later.
Step 3: Apply your experimental snippet strategies to each test group
The remaining groups become our test groups. To each of these test groups you’ll apply crafted organic snippets reflecting a particular meta description tactic. The test groups will employ your various experimental snippet strategies, while the meta descriptions for the pages in the control groups will remain completely unchanged.
Step 4: Analyze efficacy
Now you’ll have to play the waiting game. You’ll need to allow at least a month or two to pass in order to let the changes to the test groups take effect. Afterwards, you’ll have sufficient data points to analyze the efficacy of your interventions.
This next step is the most technical. Here we’ll be creating what’s known as a “bayesian structural time series” model using the control groups. This model predicts a “counterfactual” time series that represents what “would have been” if we hadn’t made any changes. We previously kept the control groups similar to one another so as to improve the accuracy of this counterfactual model.
Using this model, we’ll be able to compare one test group’s actual results (i.e., the traffic received by the test pages in that group) against the counterfactual “would have been.” Any positive or negative differences can be reasonably attributed to the intervention applied in the AB test (assuming no other changes were made to the pages).
Code-wise, this step is easy. A python package called causal_impact does all of the heavy lifting for us. We only need to feed in the control and test data, and what we get out looks something like this:
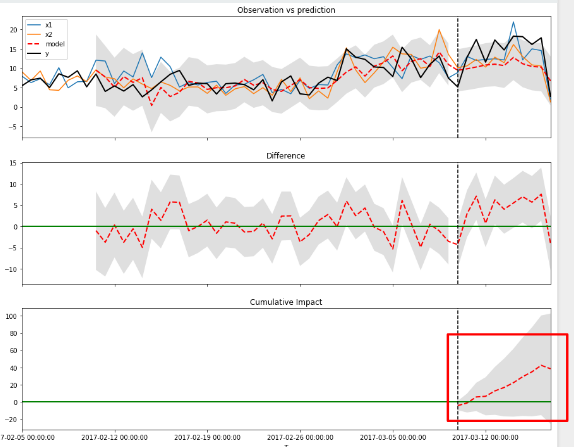
What you’ll end up with are three graphs where the X-axis measures time, the Y-axis measures the sum of new users visiting a group’s pages on a given day, and the vertical dotted line marks the date on which the meta description changes were made to your pages. The grey areas in all cases, FYI, represent a 95% confidence bound, meaning we’re 95% confident that the “real” data lies somewhere between those grey areas.
In the first chart you can see the red dotted line is the counterfactual, x1 and x2 are the controls that the counterfactual is based on, and the black line is the data from the actual test group.
The middle chart shows the difference between the prediction (the counterfactual) and the test data (the black line). The data should be at or fluctuate around zero (the green line) before the vertical dotted line marking the date the changes were made. If your meta description strategies caused positive or negative changes in traffic, to the right of that vertical line you’ll see the red line significantly deviate from the green line.
The final chart summarizes this expectation by showing the cumulative change observed between the test data and the counterfactual. Up is good. Down is bad.
The moral of the story
With your results in front of you, you’re likely to see that spending even a little time on creating more engaging meta descriptions paid off. You’re almost certain to see that, lo and behold, people are reading them!
The moral of the story is give your snippets the same consideration you would paid ads. Spend some time crafting them, and then follow the simple guide above for AB testing that’ll reveal their impact. If your CTR rates don’t show improvement, formulate a different strategy, and then test again.
As always, let us know how it goes in the comments below. And be sure to keep checking out the RankSense blog for more SEO best practices!
Feel free to check out the previous tips in this series: