Python for Data-Driven Storytelling

by Barbara Coelho | May 01, 2020 | 0 Comments

Marketers? Common. Engineers? Common. But a marketer and engineer in one? Now that’s a rare breed. Our CEO, Hamlet Batista, gave a captivating presentation at the Inbound Conference where he shared the impact that Python can have for data-driven storytelling and how it can create compelling content to make you stand out among competitors. The steps include: sourcing ideas, extracting, processing, and visualizing data, and then reframing it to create powerful, mesmerizing stories for your audience. 

Watch Hamlet’s presentation:

https://vimeo.com/358429056

View Hamlet’s presentation deck:

Python for Data-driven Storytelling from Hamlet Batista


  1. Sourcing Ideas: Where do we look for ideas?

Hamlet gets his idea from a previous trip he took with his family to Disney World. The parks are great, fun, and exciting for all, but the downside of course is the time lost waiting in those long lines. He used a subreddit called “Data is Beautiful” to find data comparing ride enjoyment to line wait times. He plans to take this data and recreate it into a visualization that will have meaning and provide a more significant impact.

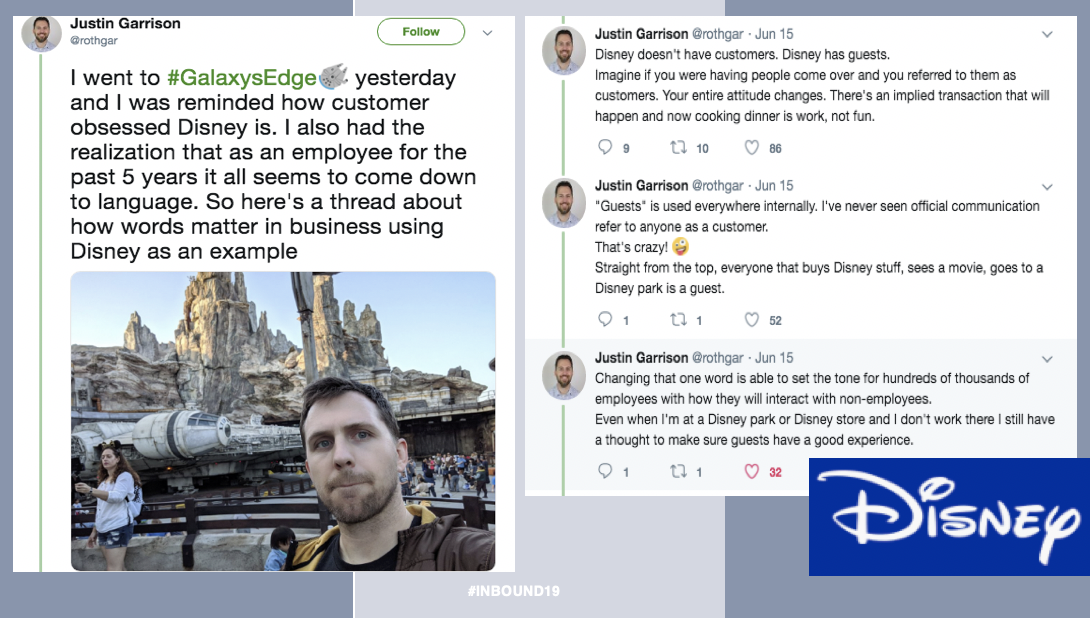
Why reframe popular stories?

Although big data proves to be useful, it lacks an emotional connection to hook the audience. Marketers and engineers appear to operate in silos—with the engineer’s focus on logic and removing all context from the data. The marketer’s job is to personalize and add back all the context to understand the target audience and provide an emotional connection. Here’s a powerful example of how Disney references the people who visit their parks to create an intimate relationship:

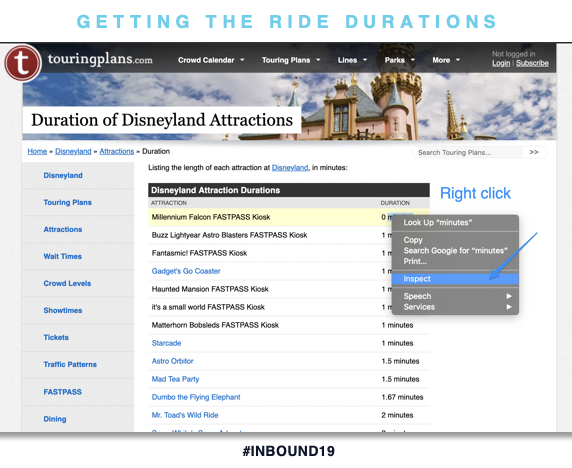
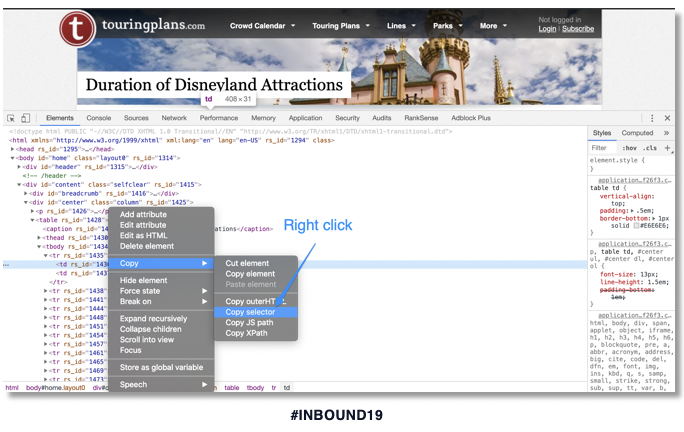
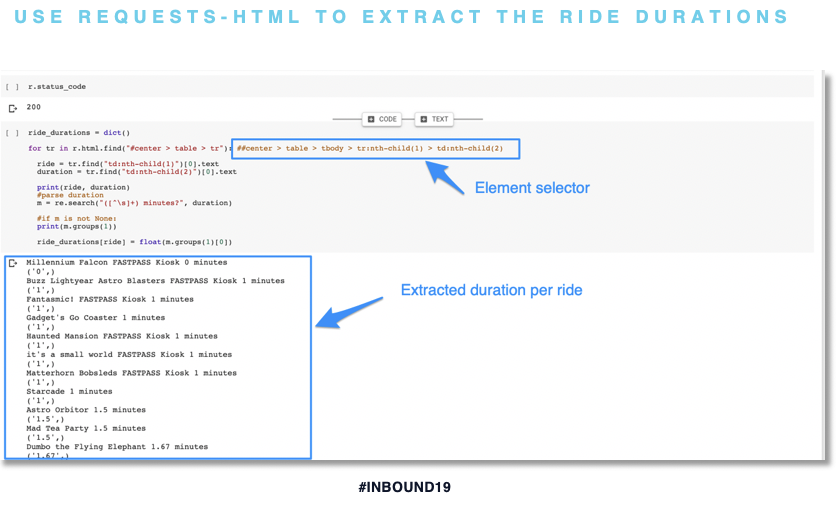
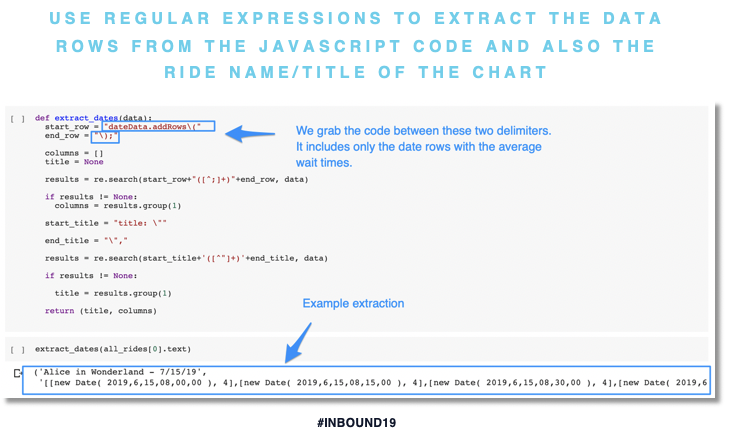
2. Extracting Data: Pulling data that matters

The first step in this phase is to extract the ride durations by first using Google Chrome to get an HTML DOM element selector with these ride times.


Next, use requests-html to extract the JavaScript snippets from the source page.

Up next, use regular expressions to extract the duration numbers.

Now we will extract the average wait times by again using requests-html to extract JavaScript snippets from the moving charts. Since the data is moving in real-time, it’s a challenging task to grab the pieces, a process Hamlet compares to catching a cab in New York City, something that will, without a doubt, test your patience, but is doable. 

Next, we can use regular expressions to extract the data rows from the JavaScript and use a Jinja2 template to return the data needed for the visualization.

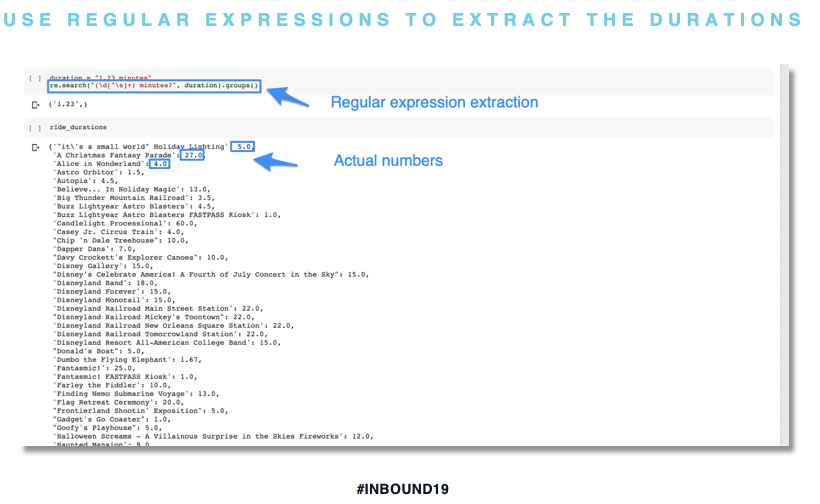
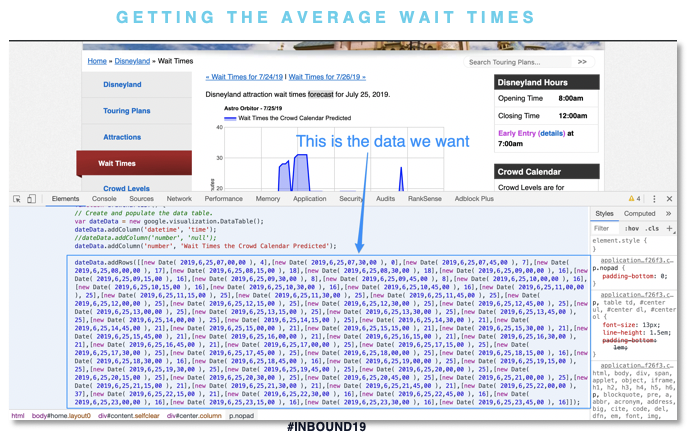
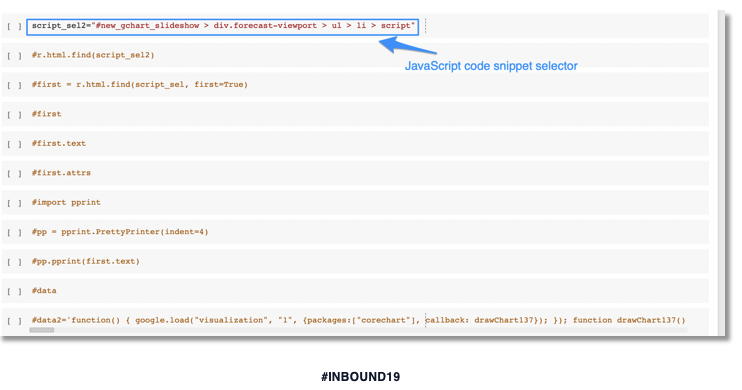
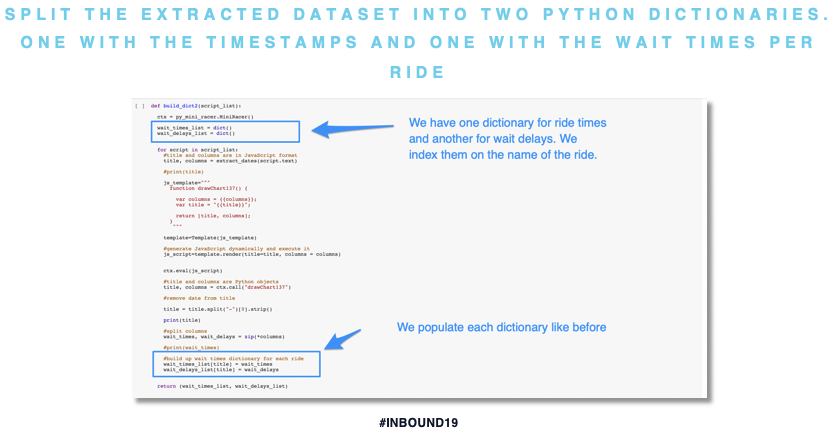
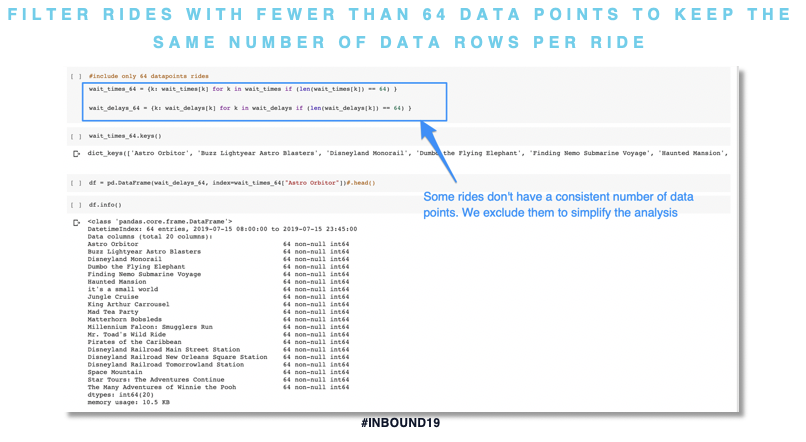
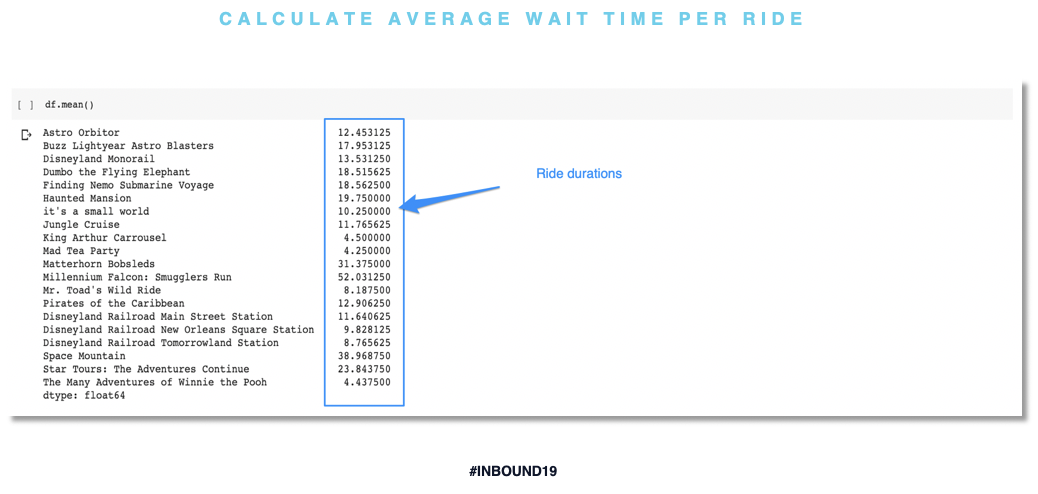
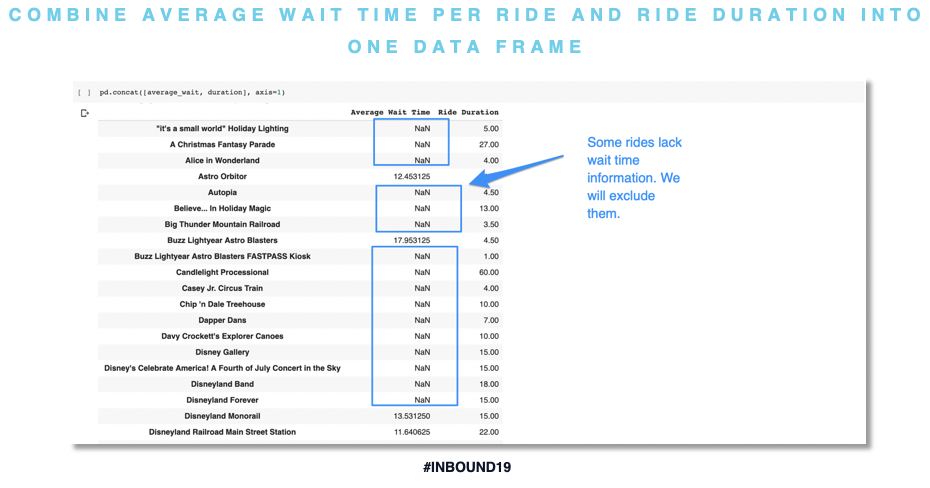
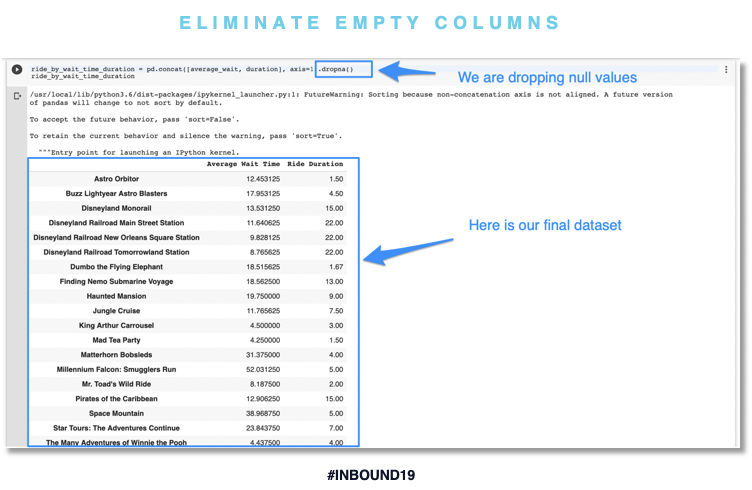
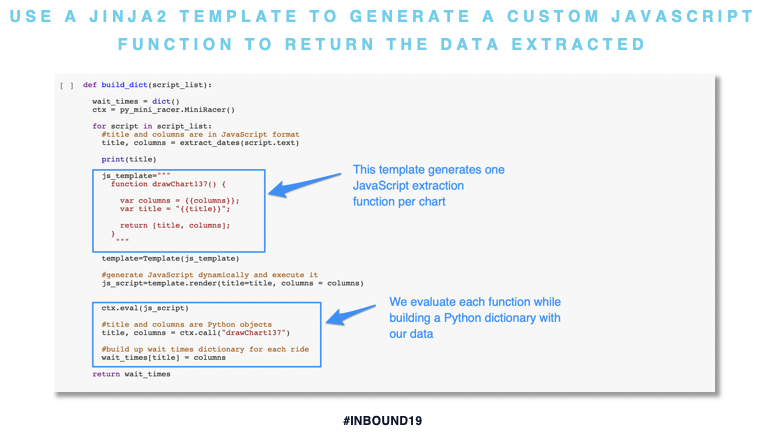
3. Processing Source Data: How do we process data to gain valuable insights?

First, we will split our data into two Python dictionaries using duration per ride and ride names. 

Then, we will filter the rides to account for those with minimal or excessive data.

Next, we will determine the average wait time for each ride and combine it with ride duration into one data frame. Finally, we will eliminate the empty columns at the end.

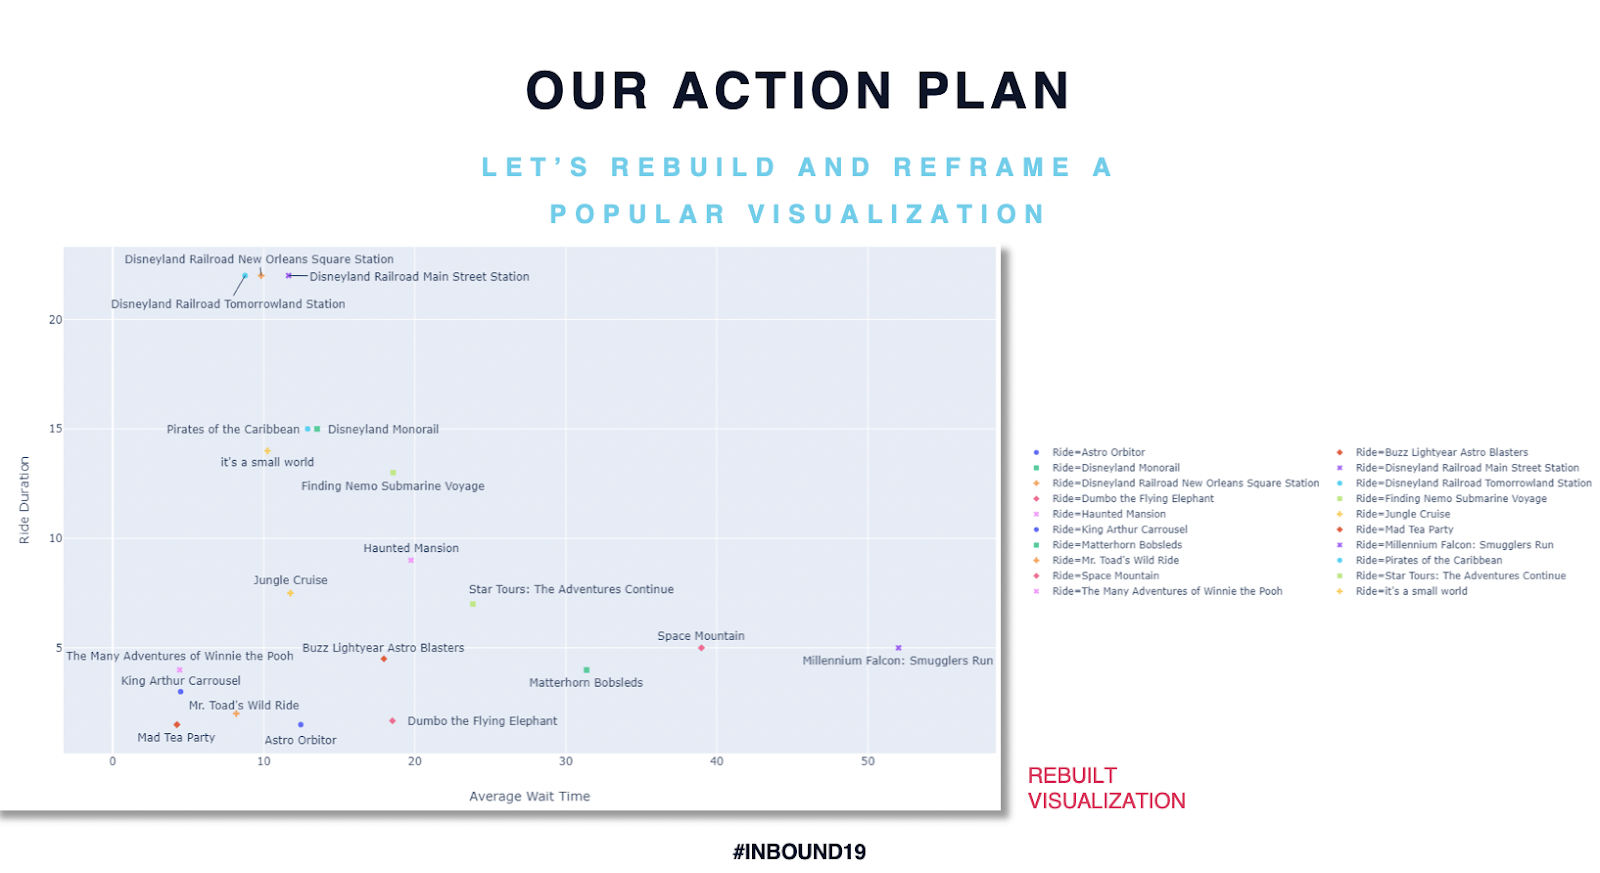
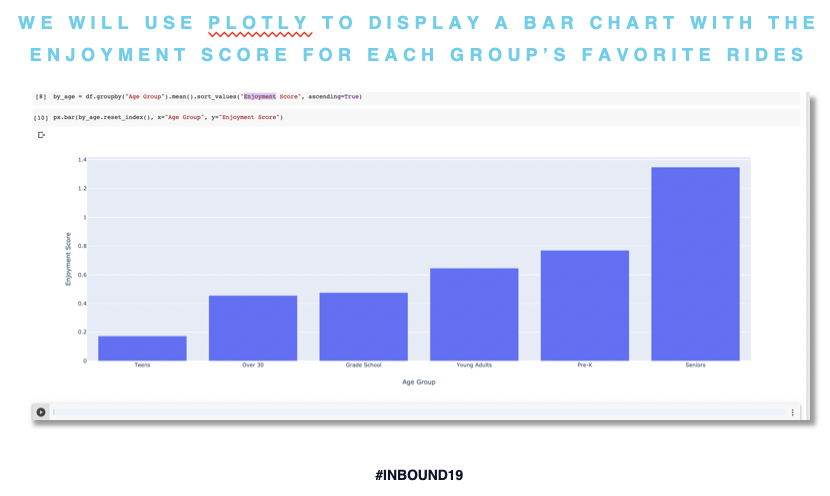
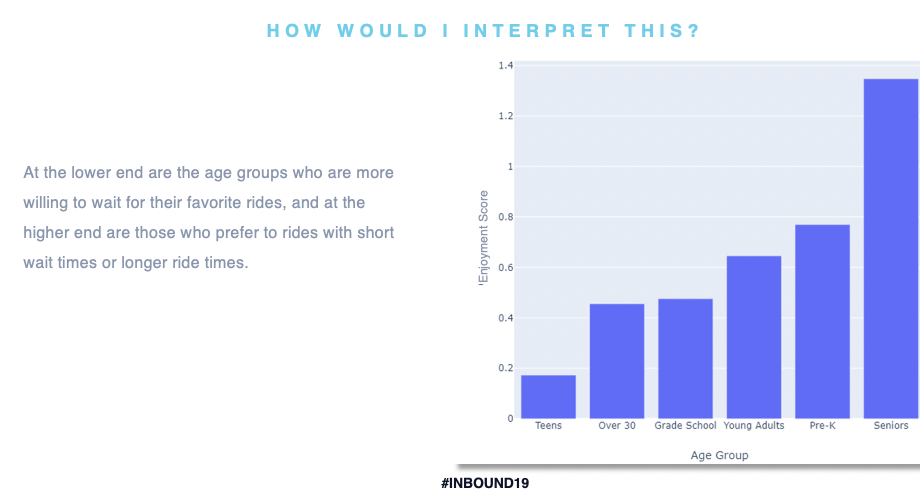
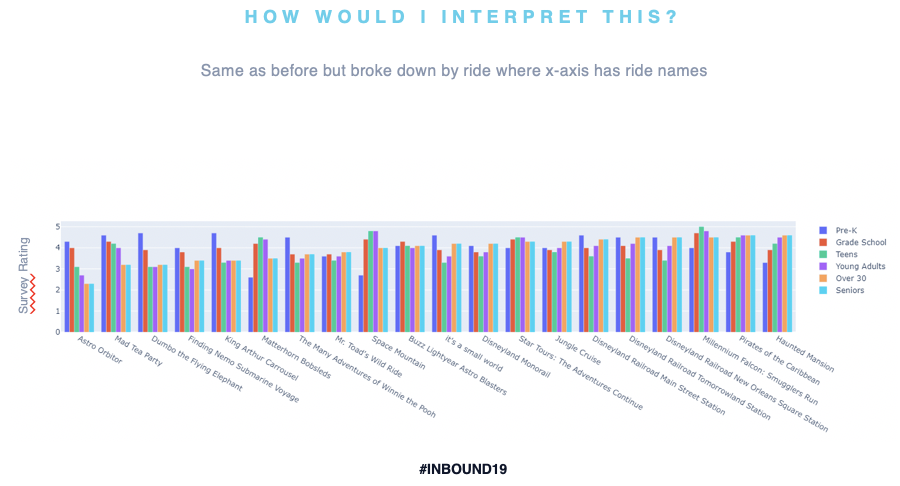
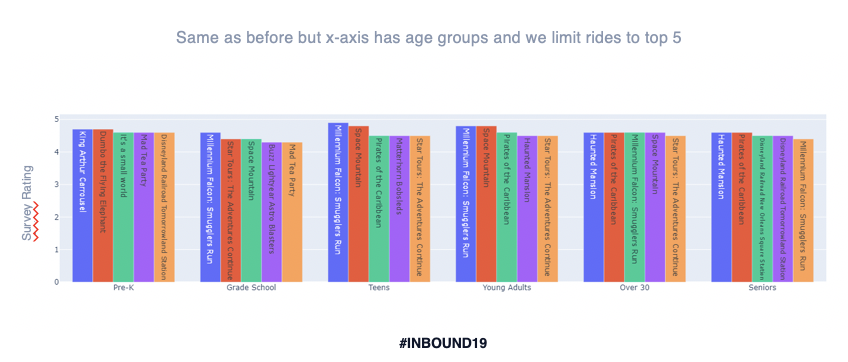
4. Visualizing Data: How do we tell a story?

This is where the power comes from—with this raw data, we can manipulate it to provide more relevant, rich visualizations for our target audience. This step is much easier: we will reformat the data frame to fit a row-oriented dictionary. 

5. Reframing Visualization: How do we connect with our customer with a compelling visual?

Here, we will add another data point, which will tell us how fun each ride was based on the age group. We will retrieve this data from https://touringplans.com/disneyland/attractions and then calculate the “enjoyment score,” the number of minutes per ride divided by the average minutes of wait time, and use plotly to display a bar chart featuring the results.

Here we have created the final visualization that not only provides valuable information but is more engaging and meaningful to our audience.

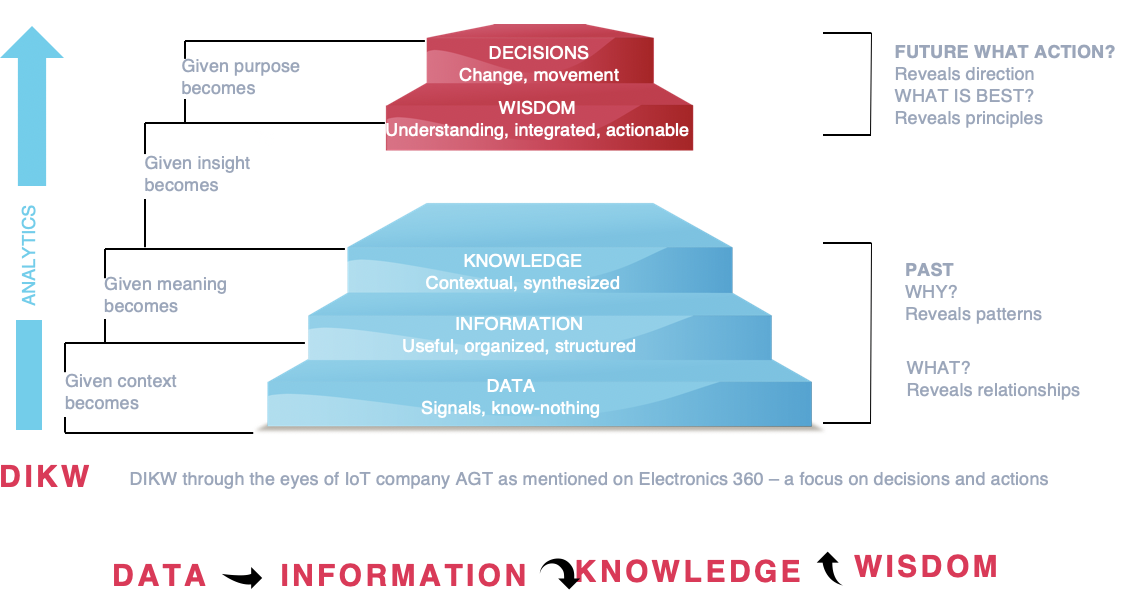
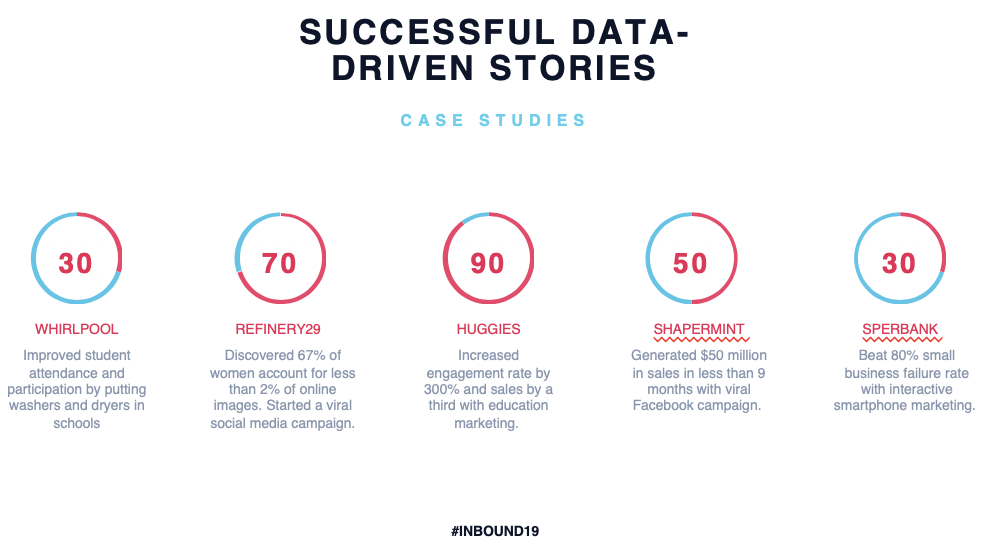
Reframing successful visualizations

The key to every successful visualization is creating an emotional connection. Who is your target audience? What is their biggest fear? Asking yourself these two questions can help you get a sense of what they’re looking for. In the travel industry, this may look like adults, families, or business people and extensive wait times at security. In recruitment, it can look like job seekers and regions with poor job growth. In real estate, it can look like house hunters and noisy cities. 

How to ask reframing questions: Using the information refinement framework

You can take these popular visualizations and adapt them to your business by turning raw data into insights. The information refinement framework enables you to recognize trends and patterns and act on the knowledge it gives you to direct your content. The DIKW pyramid is split up into four levels starting from the bottom with data, information, knowledge, and wisdom as the point. It provides a systematic, organized way to reframe this idea and adapt this to your business. At each step, you can see which types of questions you should be asking yourself, and the answers you come up with will help set your business in the right direction. 

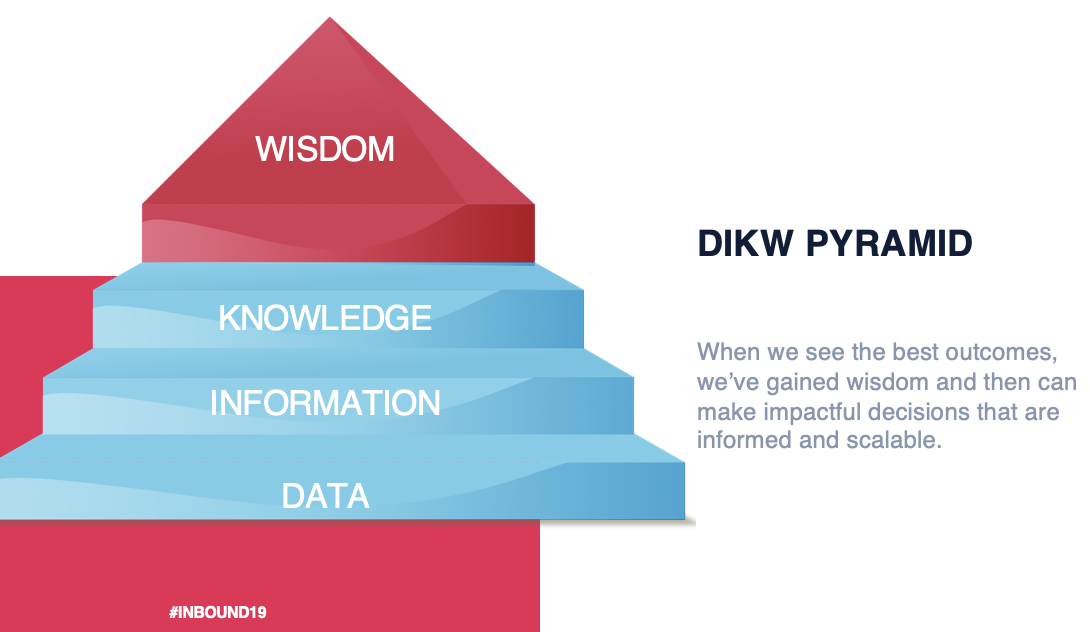
Start with possible outcomes

Creativity is not always linear—you don’t necessarily need to start with data and finish with insights. Sometimes, you start where you’re most comfortable, as Jeff Bezos says, “Start with your customer and work backwards.”

Why tell data stories?

When it comes to standing out, it may be challenging to grow your content and have people read, watch, and pay attention to it. The concept of “riding existing demand waves” taps into preexisting demand and desire for a product and allows you to channel it by telling unique, relatable stories.

Entrepreneurs, for example, follow this concept by tapping into an existing need and creating an emotional connection to be successful. The two most important things to focus on when determining how to build this emotional connection is narrowing your target customer and presenting a message that will move them. This is essential since different emotions appeal to different groups of customers. One company that achieved significant success in establishing an emotional connection with its customers was Huggies. They conducted a study which found that hugging your baby resulted in health benefits for children, and then used this data to their advantage through education marketing, which increased their engagement rate by 300% and their sales by 33%. Below are additional examples.

The power is in your hands—turn your hard data into a powerful, compelling story to build emotional connections with your audience that will help you stand out among your competitors and succeed.

New to coding? Try out Codecademy and Kaggle to start learning the basics!

Barbara Coelho

Social Media Manager

0

REPLIES

Comments are closed.

Try our SEO automation tool for free!

RankSense automatically creates search snippets using advanced natural language generation. Get your free trial today.

OUR BLOG

Latest news and tactics

What do you do when you’re losing organic traffic and you don’t know why?

Getting Started with NLP and Python for SEO [Webinar]

Custom Python scripts are much more customizable than Excel spreadsheets.  This is good news for SEOs — this can lead to optimization opportunities and low-hanging fruit.  One way you can use Python to uncover these opportunities is by pairing it with natural language processing. This way, you can match how your audience searches with your...

READ POST
Making it easier to implement SEO changes on your website

Changes to the RankSense SEO rules interface

As we continue to improve the RankSense app for Cloudflare, we are always working to make the app more intuitive and easy to use. I'm pleased to share that we have made significant changes to our SEO rules interface in the settings tab of our app. It is now easier to publish multiple rules sheets and to see which changes have not yet been published to production.

READ POST

How to Find Content Gaps at Scale: Atrapalo vs Skyscanner

For the following Ranksense Webinar, we were joined by Antoine Eripret, who works at Liligo as an SEO lead. Liligo.com is a travel search engine which instantly searches all available flight, bus and train prices on an exhaustive number of travel sites such as online travel agencies, major and low-cost airlines and tour-operators. In this...

READ POST

Exciting News!
seoClarity acquires RankSense

X